The individual project page
Projects & TagsProjectsHandbookCheck a specific project's status, review hours and create quick reports.Whether you’re a freelancer or manage a team, it’s important to know exactly what’s going on with a project at any given moment. Timely provides you with the essential project statistics you need to stay on budget, update any stakeholders, and allocate your team resources effectively.
Accessing individual projects
Every project in Timely has its own dedicated page. Click on the Projects page where you’ll find both the Dashboard and All Projects tabs. Simply click on the name of any project and you’ll get access to its unique project card.
When you’re on a project’s individual page, you’ll notice six tabs:
- Status – your project overview
- Activities – a list of all user and budget-related activities
- Timesheets – a list of the hours logged to the project
- Report – create a report and share data about your project
- Invoices – connect to QuickBooks Online and generate invoices
- Tasks – schedule to-do lists directly to a project
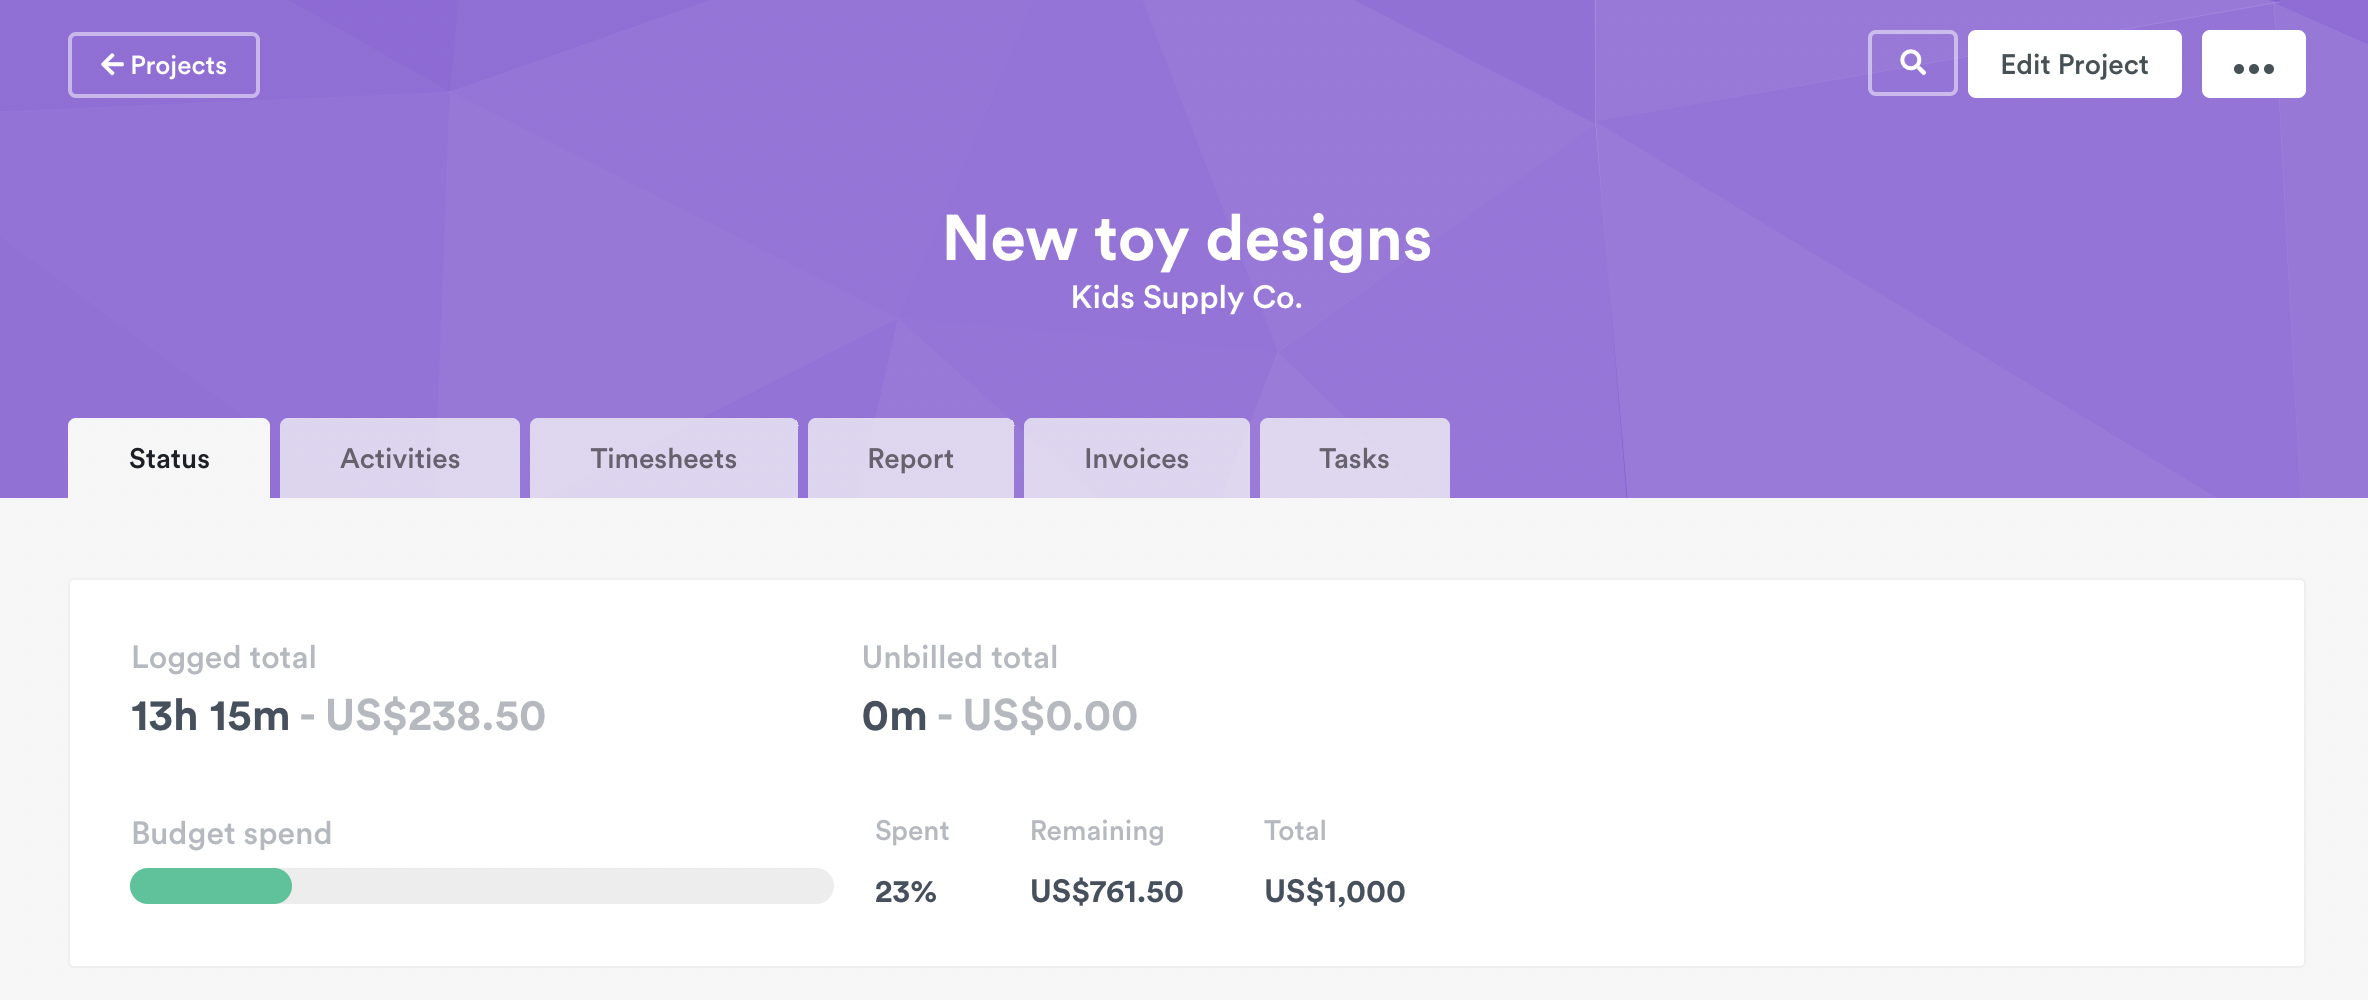
Status tab
This section is designed to give you a breakdown of the progress of your project. Depending on the details of the project you can see:
- The number of hours logged to the project
- How much of the budget has been spent (Time or Money budget)
- Planned time versus logged time
- Which users are working on the project
- Tags that are associated with the project
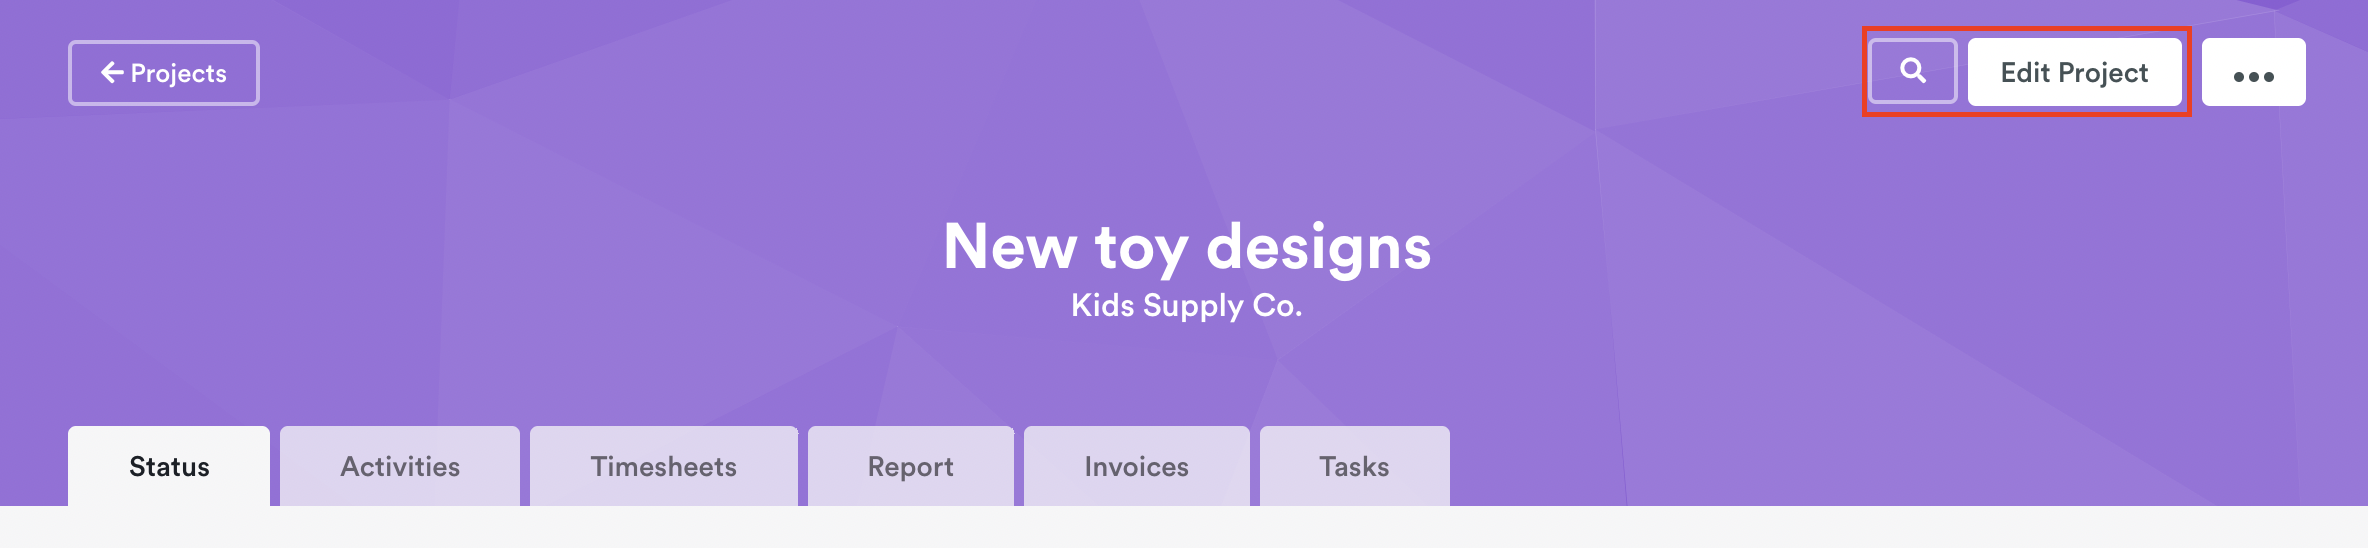
If you’re looking to make edits to the project (updating your budget or adjusting user hourly rates), click the Edit Project button on the top right-hand side of the screen:
Activities tab
The Activities tab is your personal assistant, reporting back to you on all important user and budget activities. It provides live updates on work-in-progress, from hours logged and the project’s current budget status to business-critical actions you should be aware of.
You’ll find three buttons that give you three different filters: All activities, Regular activities, and Anomalies. The Anomalies view shows what the AI has determined is out of the ordinary for that project.
Notable Project Activities:
- When the project was created
- When the project was archived
- Users added to the project
- When users logged hours for the first time
Budget Notifications:
- Budget for the project reached 100%
- Budget for the project reached 80%
- Budget for the project reached 50%
Timesheets tab
While the Status tab gives you the big picture of a project, the Timesheets tab shows you the granular detail. It’s a chronological view of who’s been logging hours on a project.
By default, you’ll see all logged hours and money across the current period. You can customize your view by using the drop-down filters to select specific time frames or activities for certain users and tags.
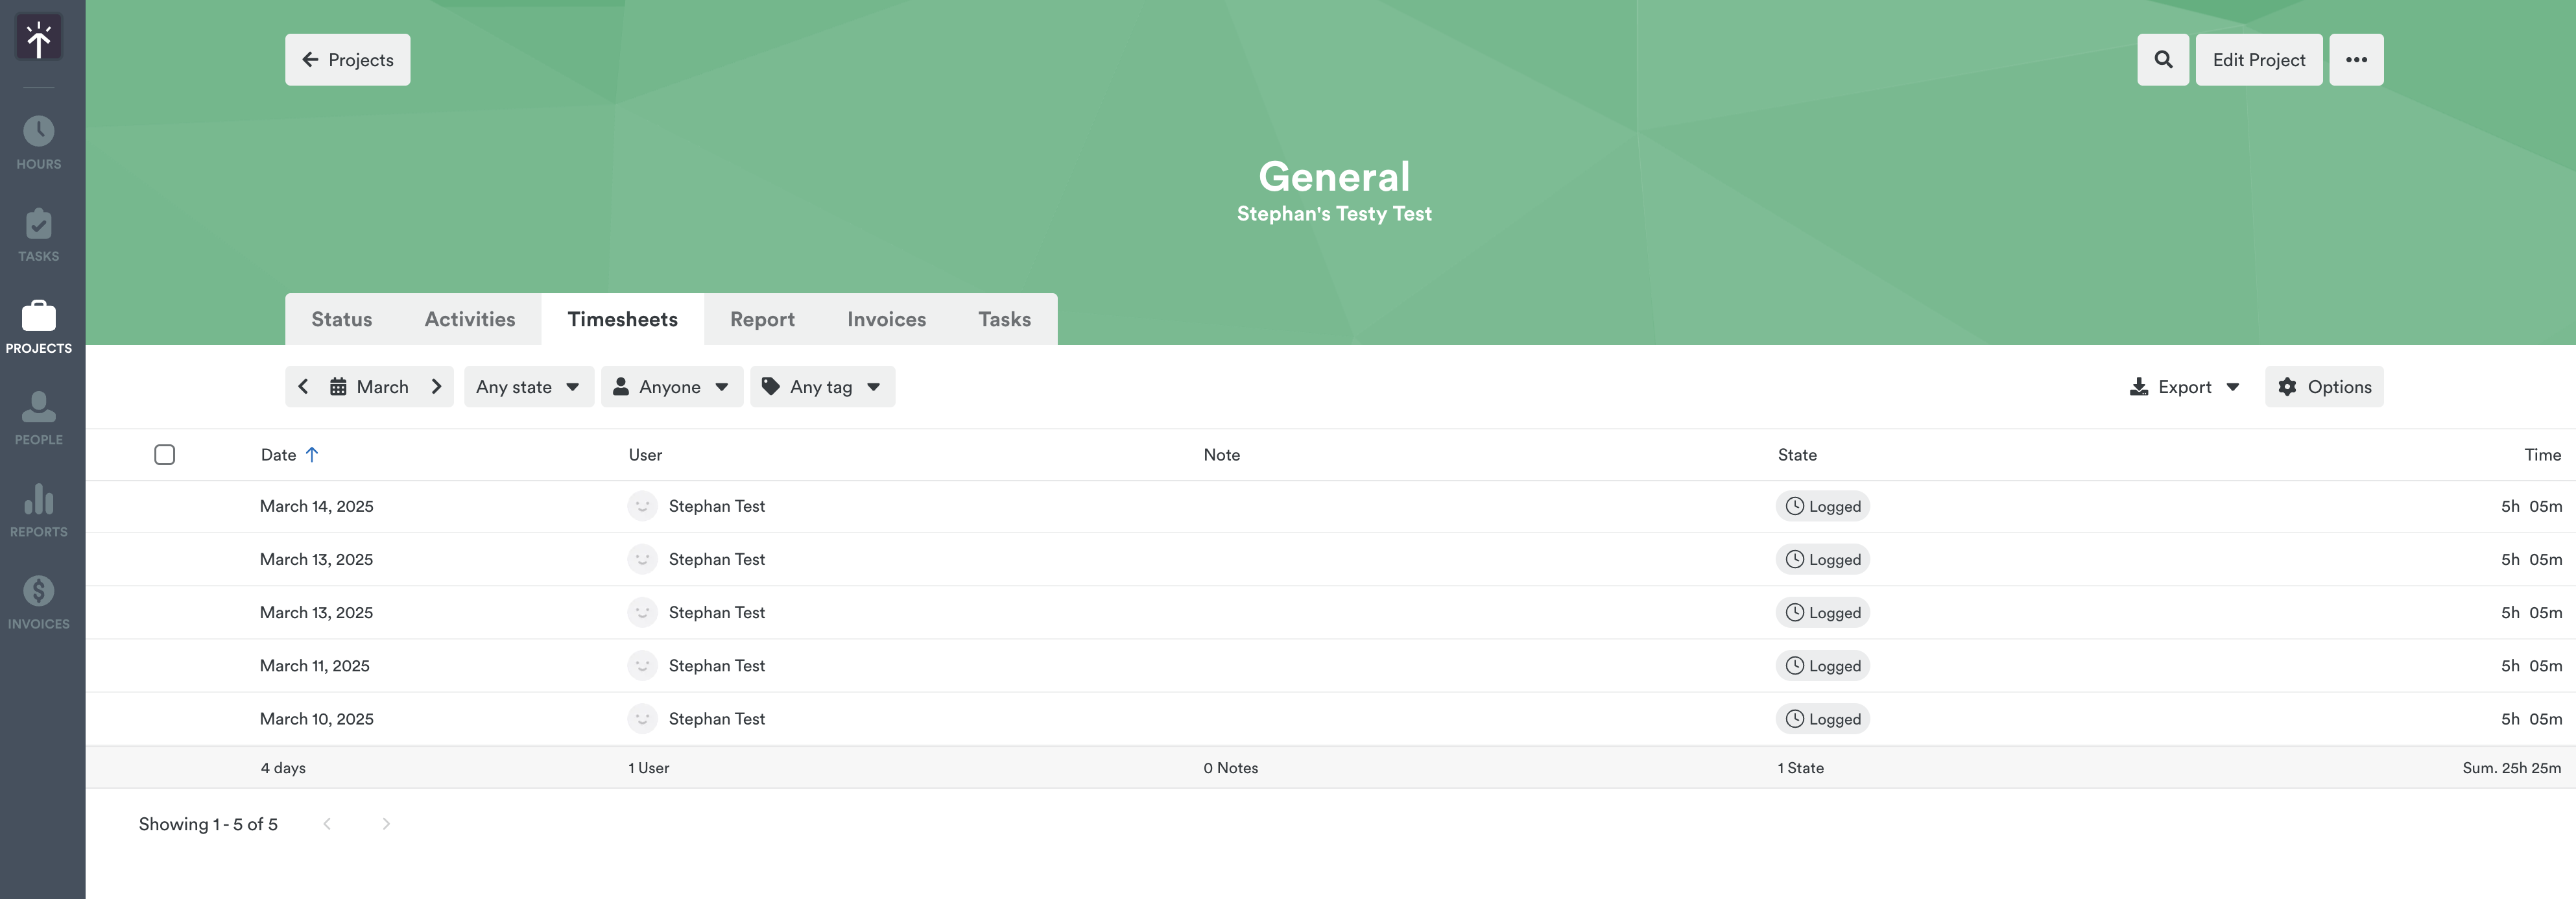
Click any time entry to see more details—or, if you have the right access, edit unlocked or unbilled hours for other users.
At the bottom of the page, you’ll see the total sum for each column:

Click Options (top-right) to customize which columns and data points appear:
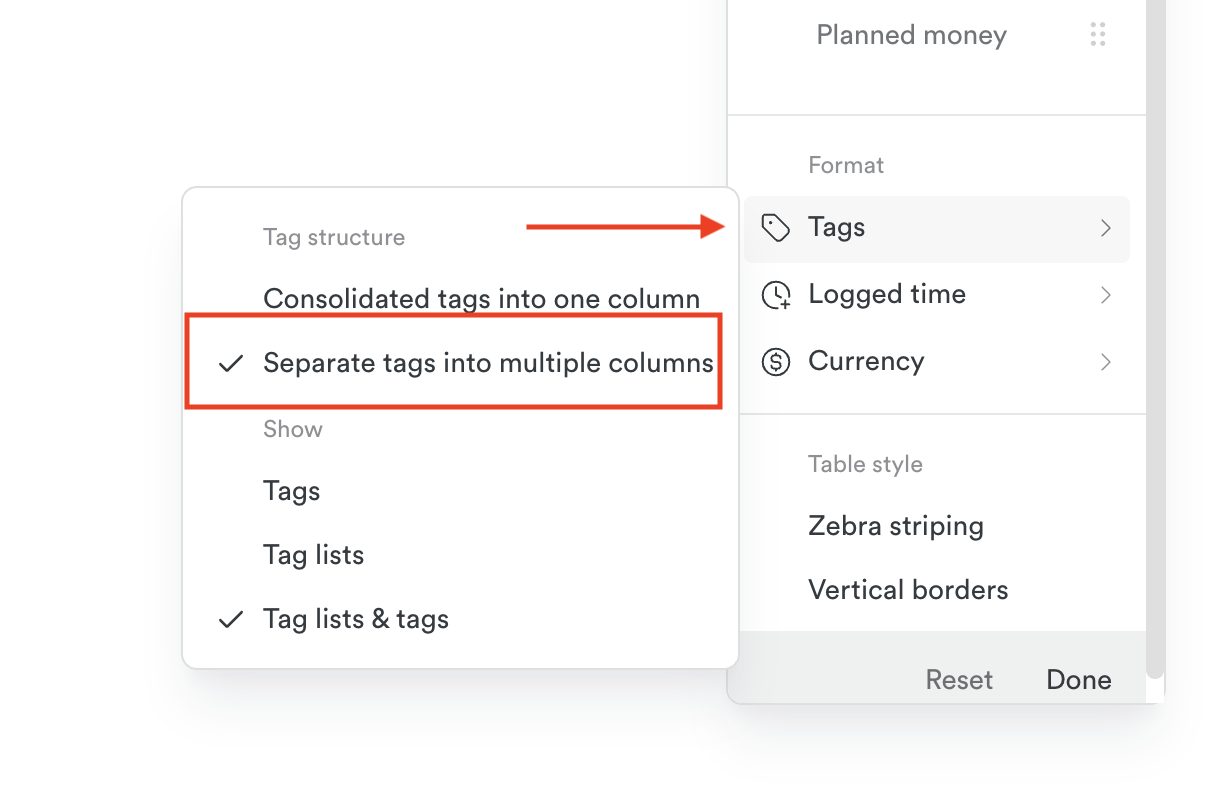
Split Tags into Separate Columns
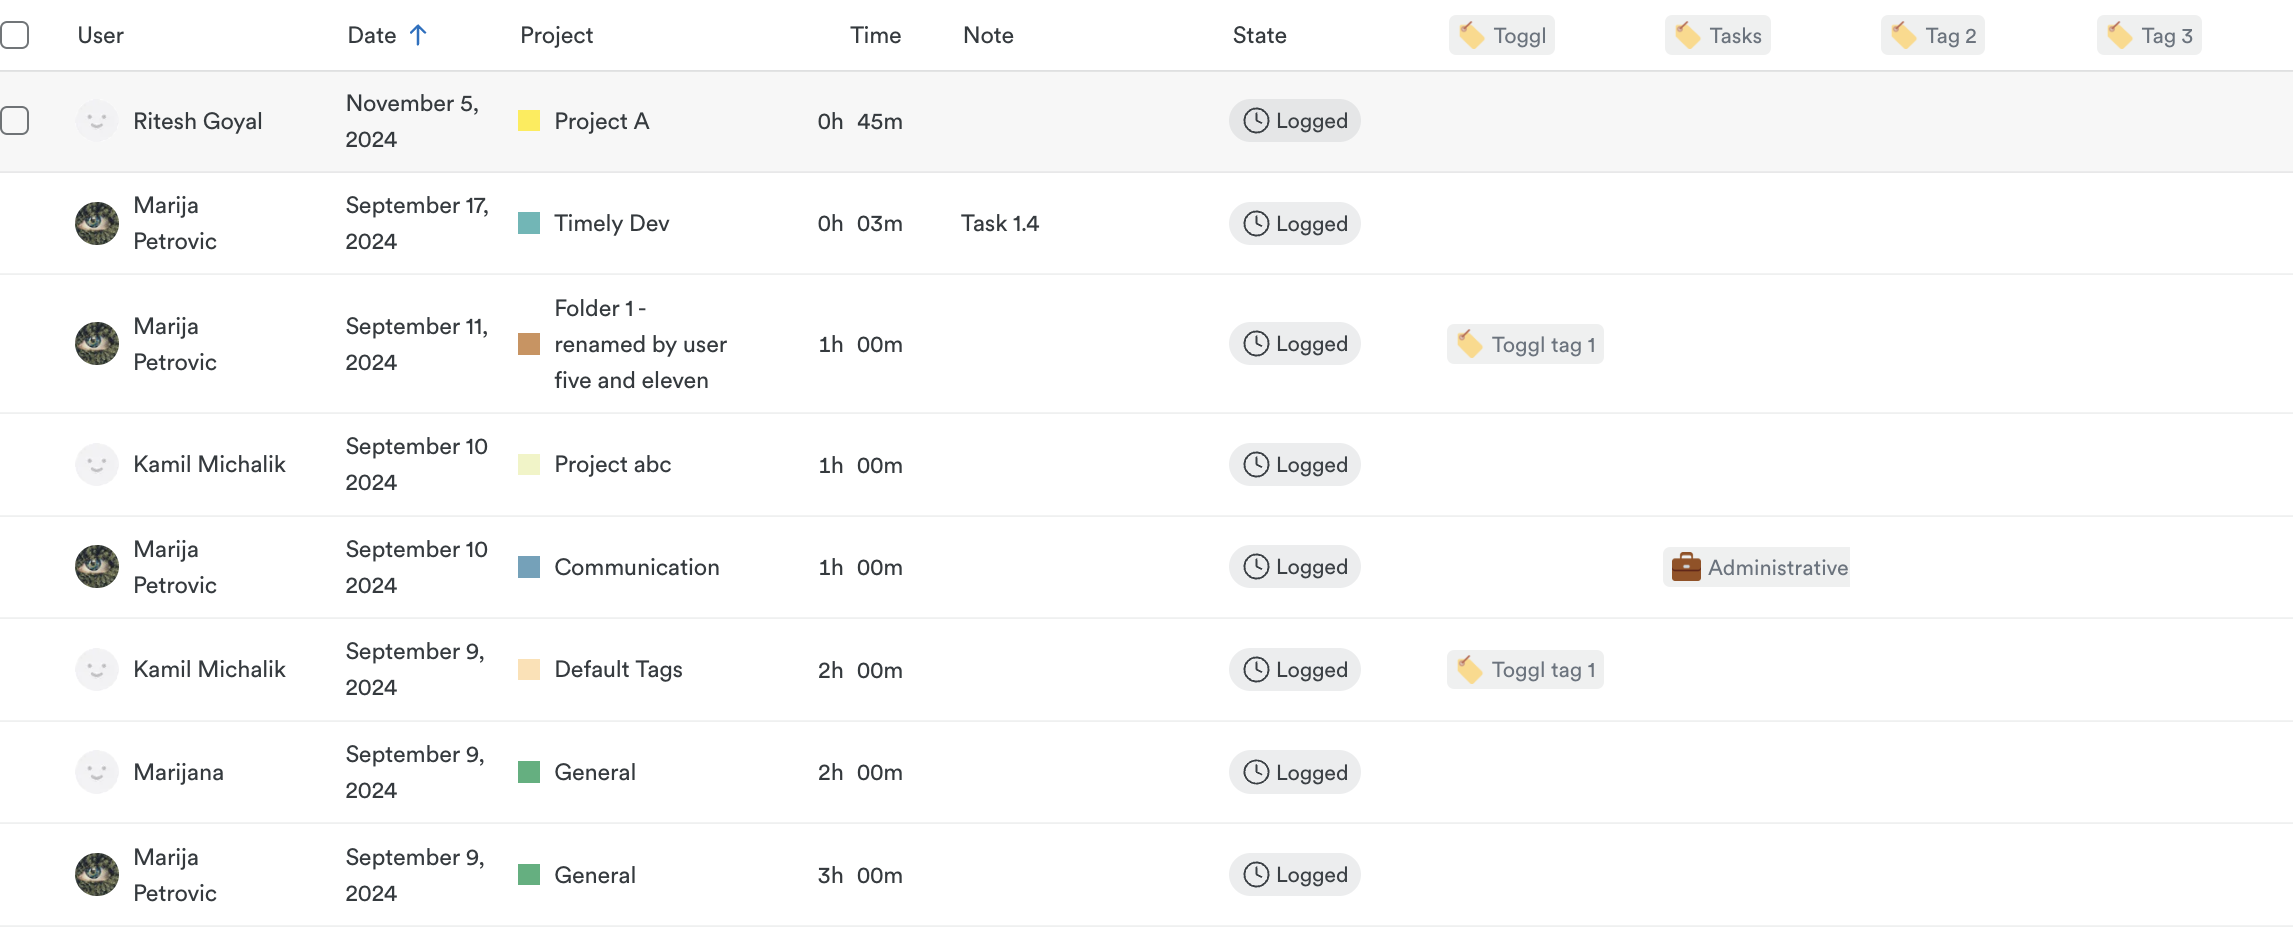
Want to track hours by individual tags at a glance? Go to Options > Tags and select “Separate tags into multiple columns.” Timely will break them out neatly into dedicated display columns—giving you a clearer picture of where hours are being spent.
Here’s how it looks:
Bulk Updating Entries via Timesheets
From the Timesheets tab, you can easily update time entry states—including any custom states you’ve set up. By default, entries start in the Logged state. Just select the entries you want to update, select the desired state from the drop down along the top, click Update State, and then click the Update button to save your selection.
Reports tab
Here you can quickly create and share reports detailing a project’s progress, total logged hours, and project task or phase breakdown. Everything can be shared via a URL link, or exported to PDF or Excel files.
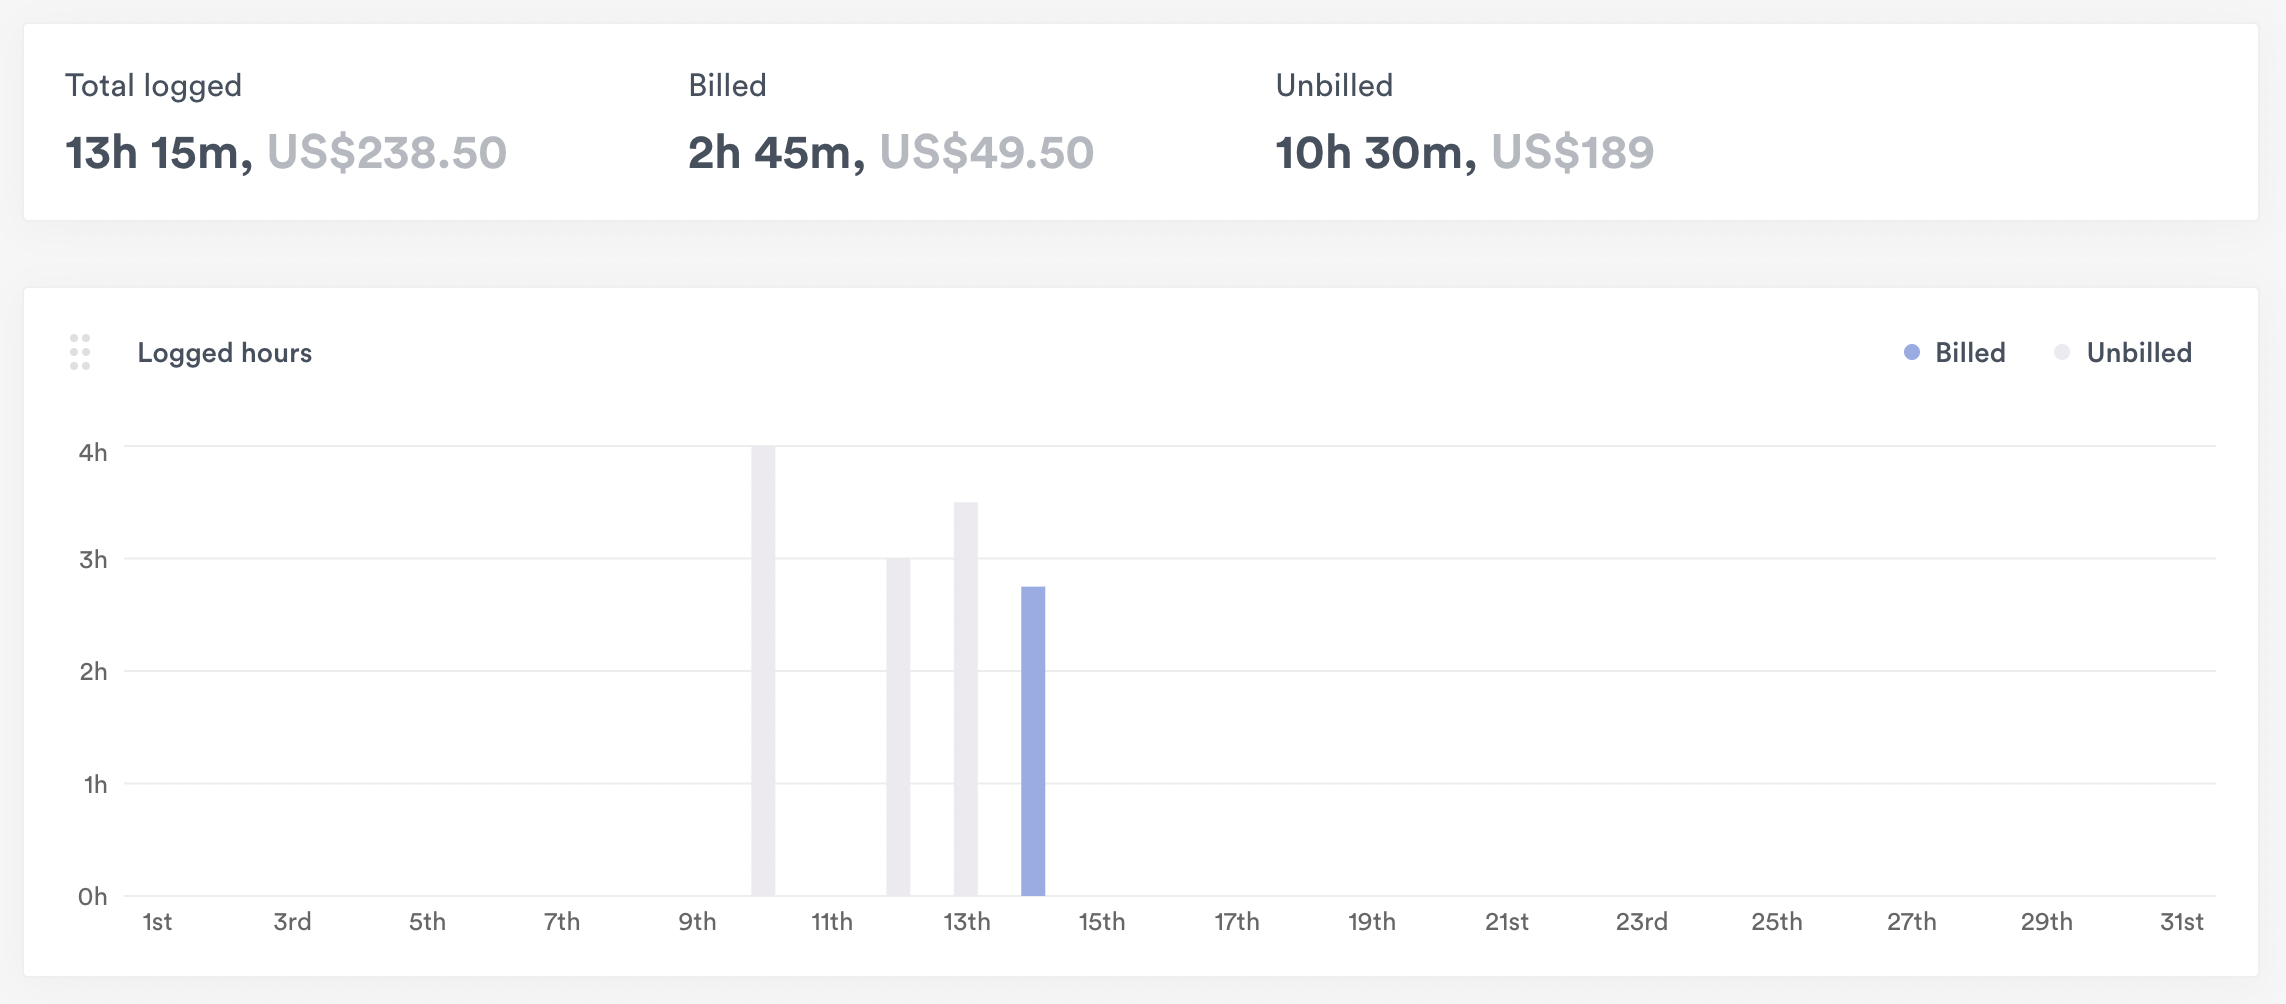
Logged hours graph
The Logged hours graph visualizes all logged project hours for a specific timeframe. You can instantly see where a project was most and least active, and when it began and finished.
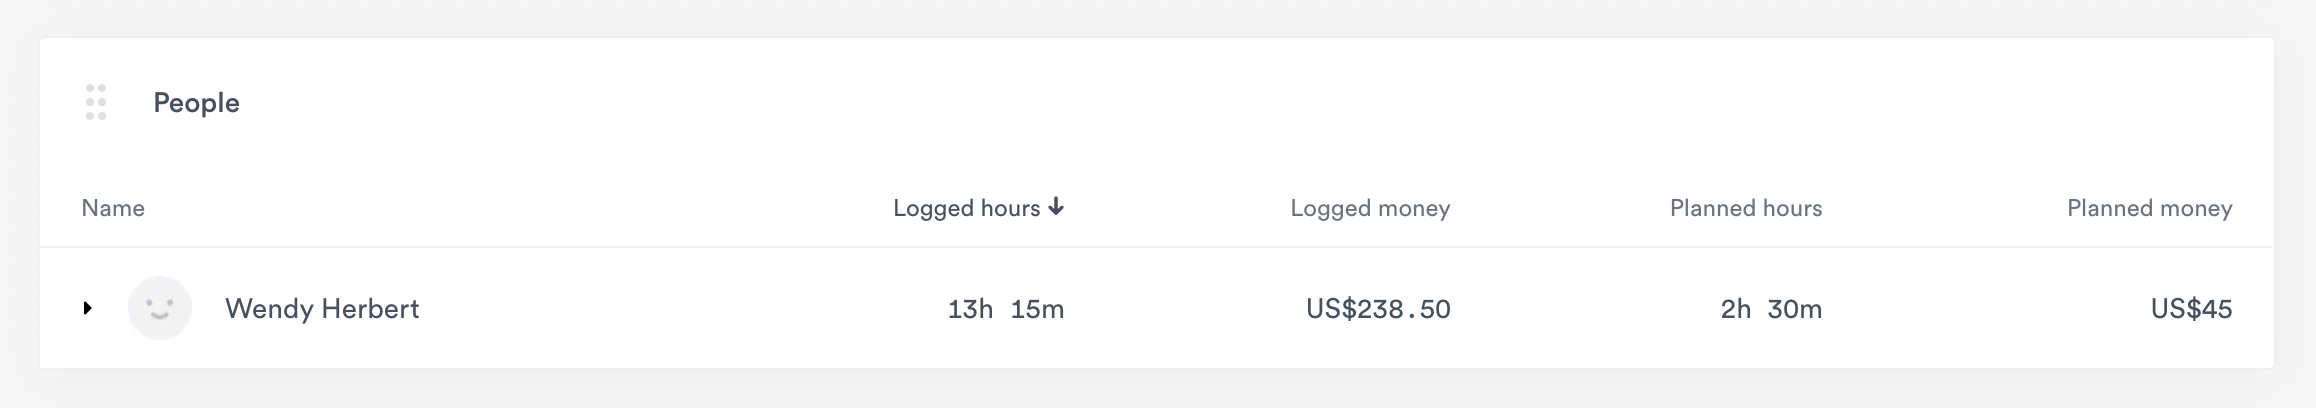
People chart
This chart gives you a visual overview of each user’s project contribution. Filter down to just one user or compare numbers for everyone involved in the project.
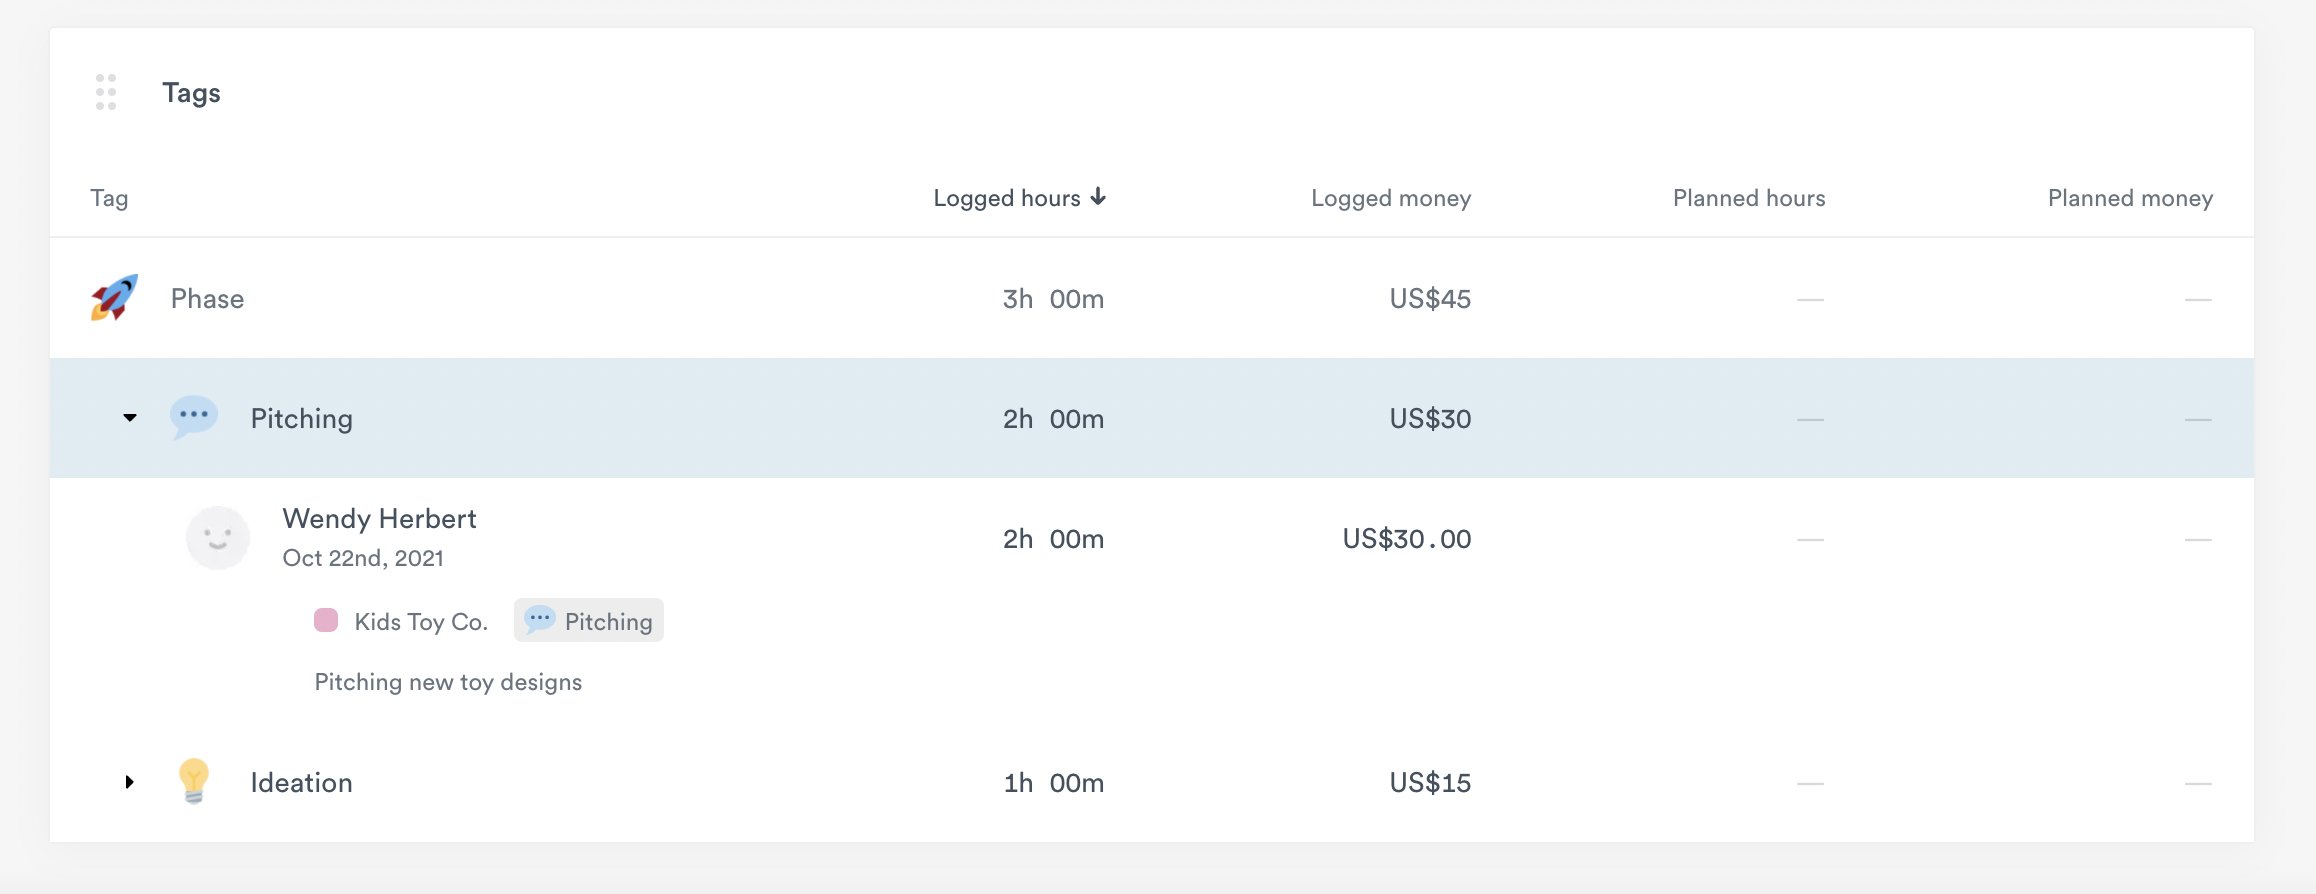
Tags chart
Tags help you understand how much time and money have been logged on a project phase. They also give you the insight you need to create better project proposals—if you know a particular project phase tends to take 50 hours, you can forecast a more accurate proposal for future projects.
You can monitor project phases using tag lists and tags which can be created in Settings.
Invoices tab
For QuickBooks Online users, you can create invoices directly from the Invoices tab. Click the + New Invoice button to get started:
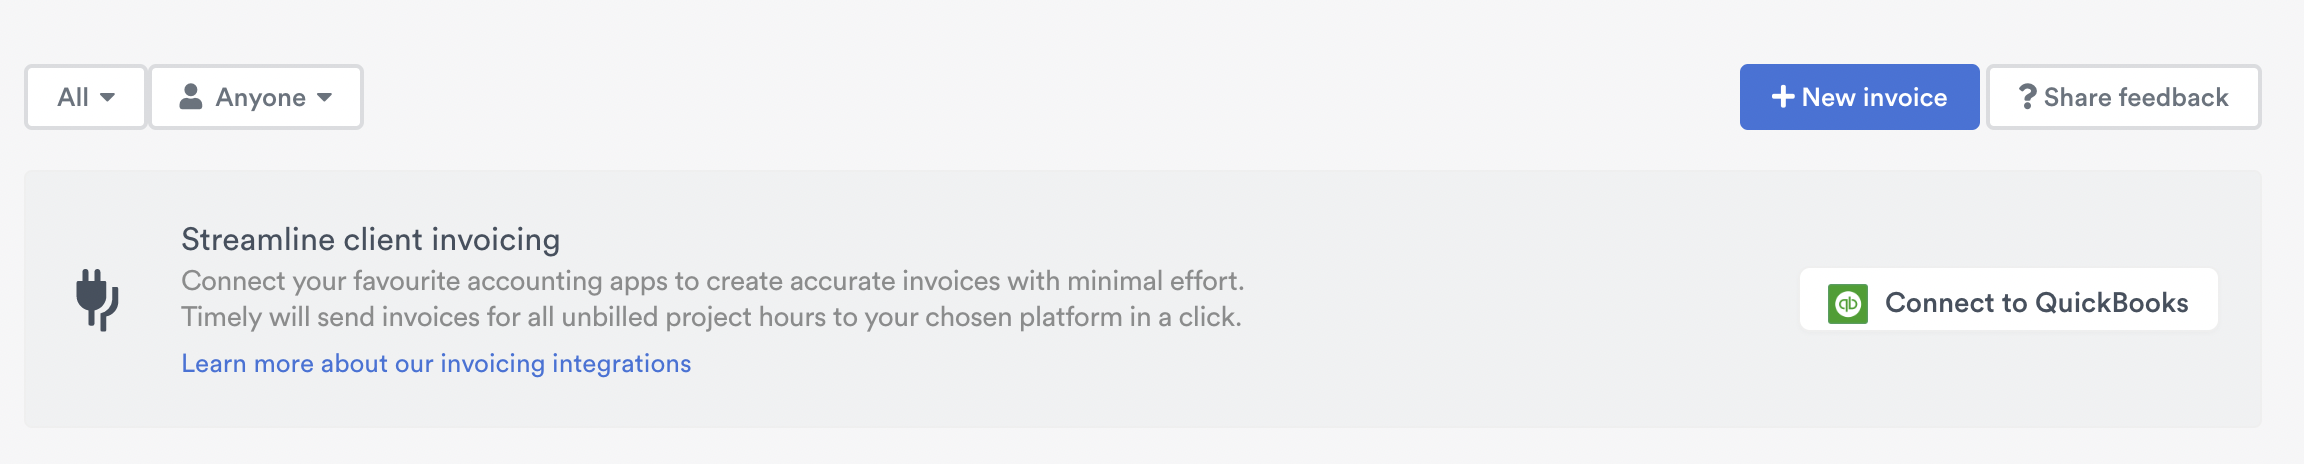
Here you’ll be able to see all the data you need to create an invoice. Timely collates billable hours ready for you to invoice. You’ll see that by clicking Show details.
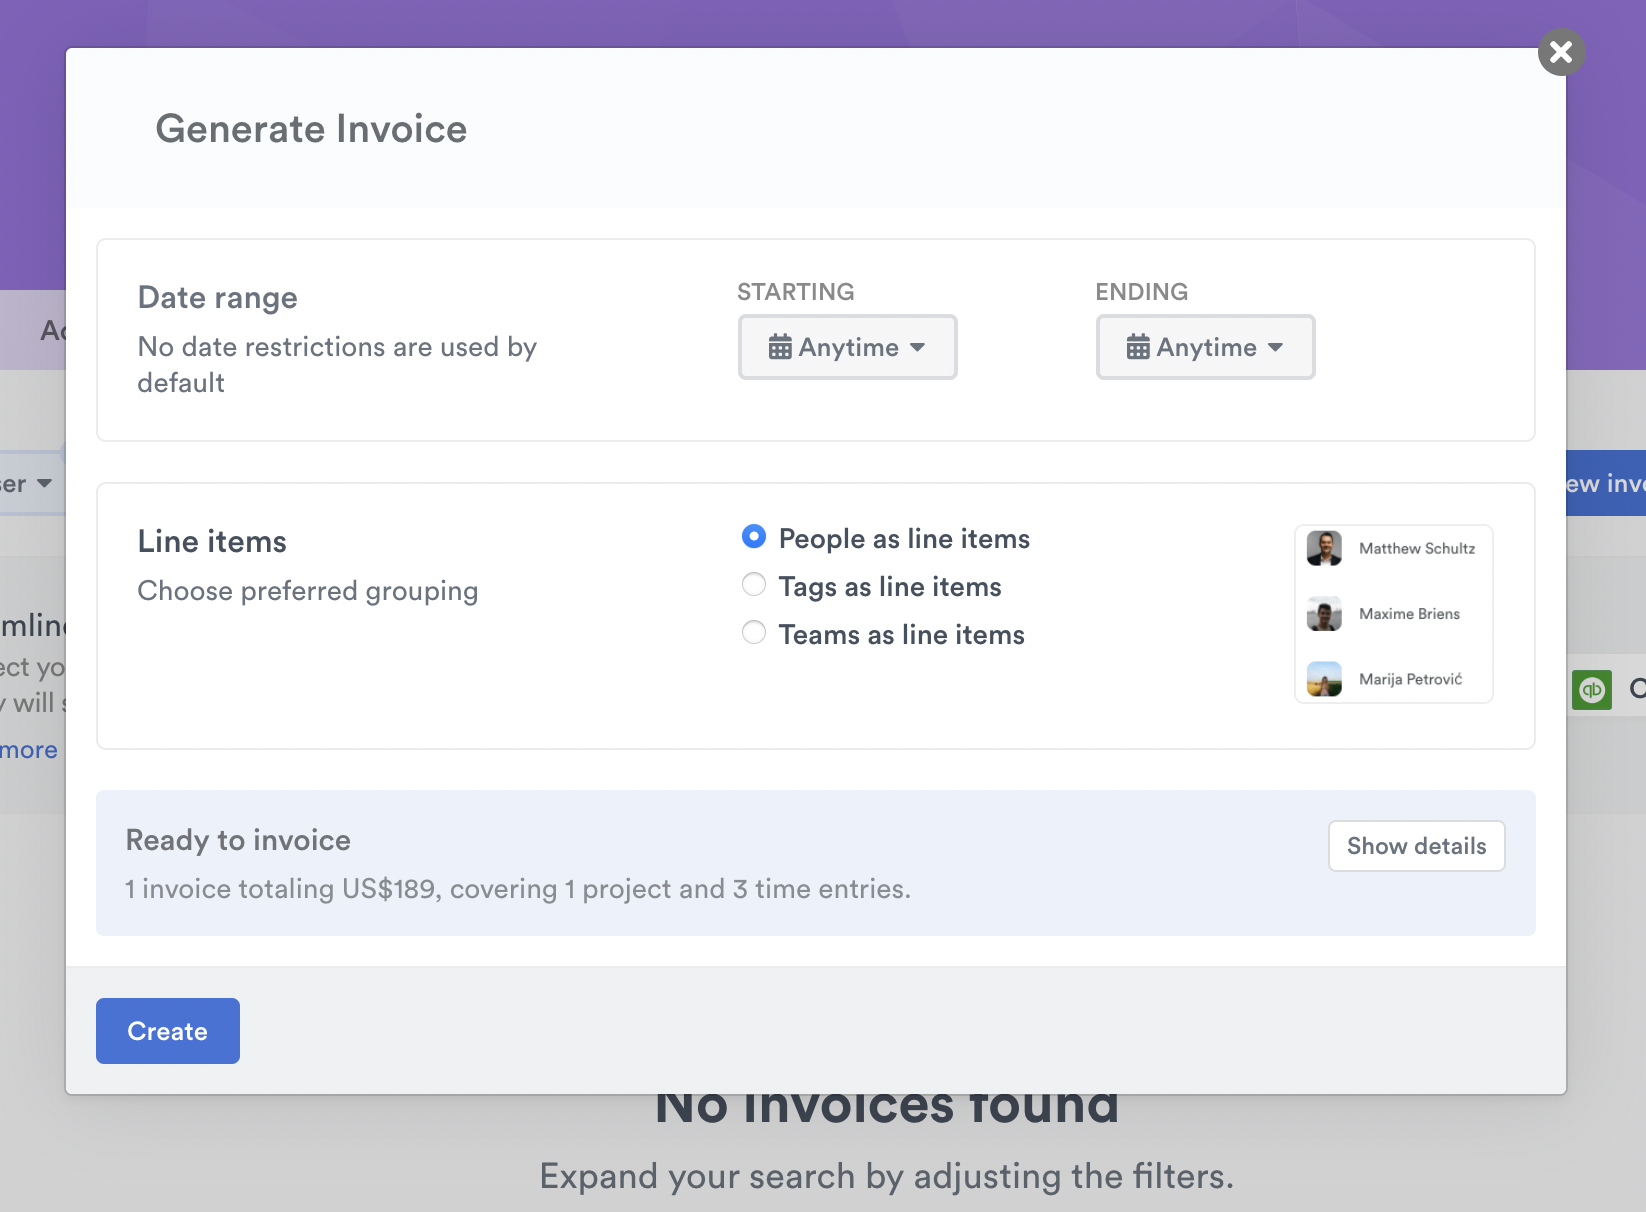
Even if you don’t have QuickBooks Online integrated, Timely still allows you to create a local draft with invoice information. You can use this for your own information and reporting or can copy/paste that information into another tool or app if needed.
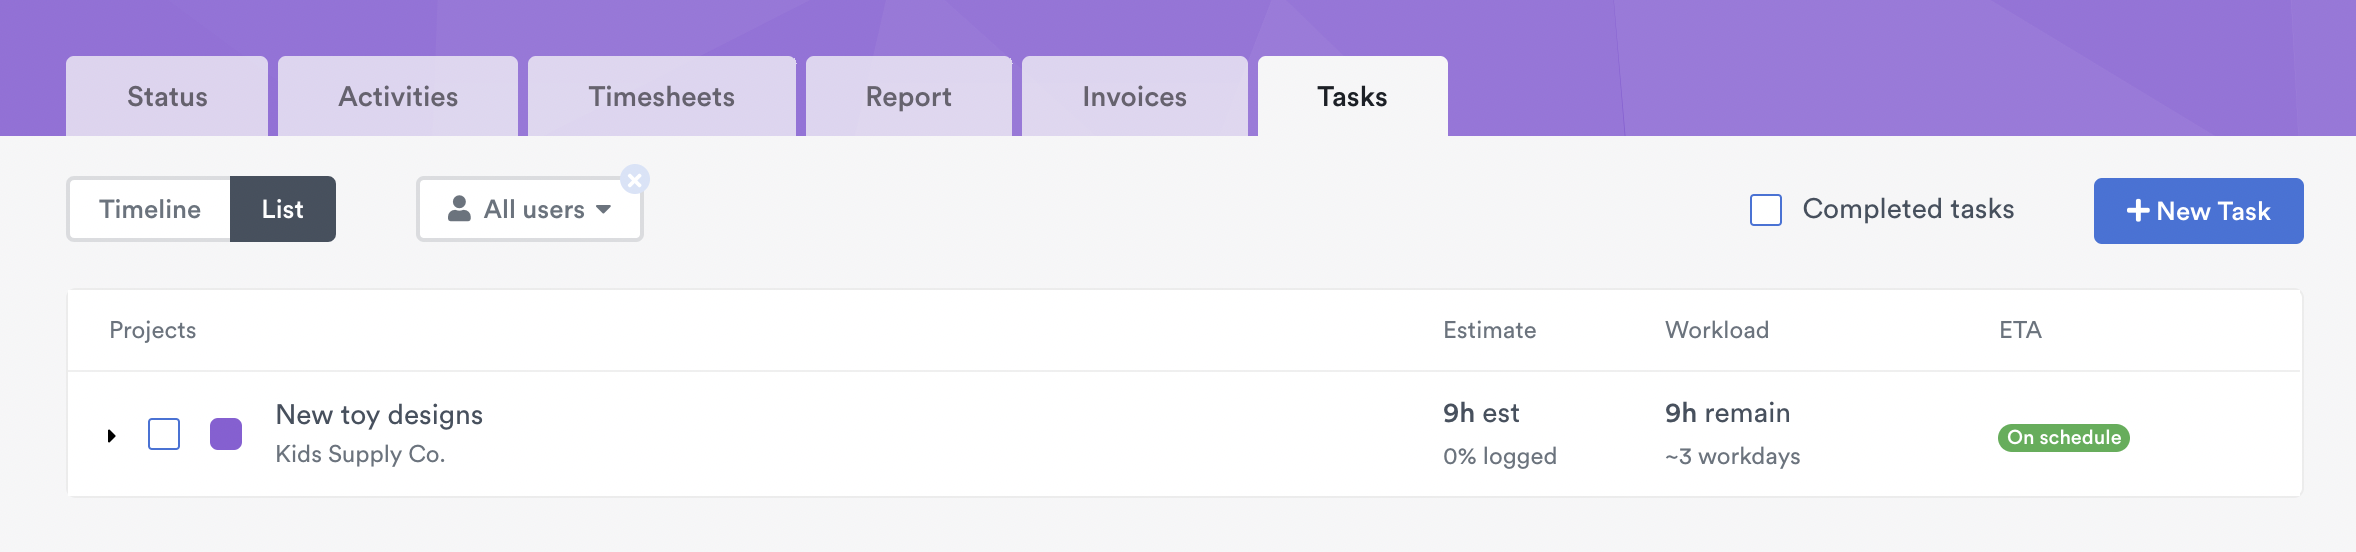
Tasks tab
The Tasks tab gives you the ability to add planned time or assign tasks to users for a specific project. Adding tasks directly to your projects helps bigger projects get broken down into more manageable pieces. Plus, it helps keep everyone on time and sticking to the budget!
You can easily add new tasks directly in the Tasks tab. Just click the + New Task button and you’re good to go!
Last updated April 1, 2026
Have feedback for this article or need more help? Contact us now.